Esri User Conference
Building the Self-Maintaining GIS
or: How I Learned to Stop Worrying and Love the Pipeline

Taylor Ward
GIS Manager, Upstream Oil & Gas
or: How I Learned to Stop Worrying and Love the Pipeline
My company is an upstream oil and gas operator running across three states, with roughly 3,500 operated wells plus a substantial non-operated position spread across numerous partnerships. I've been building the GIS department's automation here for nine years, currently as half of a two-person GIS team supporting close to 225 employees across two corporate offices and three field offices.







































Well data alone passes through Kingdom, Wellview, ProdView, Geographix, Quorum, and Aries before it ever reaches a map, and none of those vendors built their product to talk to the others. Add Cygnet, EHS DataMonster, the Texas RRC, and Microsoft Entra, and GIS ends up as the only team standing in the middle of all of it.
We got tired of manually stitching those systems together every time someone asked, so we built the pipeline instead.
Need to know which wells are on this gathering route? Ask operations. Need directions to a well pad? Ask the field crew. Want to know where the rig's headed next? Ask the lease operator. Every one of those is a phone call away. So why bother pulling any of it into GIS at all?
Every pipeline in this talk runs the same way underneath, no matter which system it touches. Azure DevOps Pipelines does the orchestration, on a fixed schedule rather than a webhook from the source system, and the code behind it lives in Azure DevOps Repos with real branches and pull requests, the same discipline you'd expect from any software team, not scripts parked on somebody's desktop.
Not to mention: this touches almost everything in the company, these are just a few of these examples.
The best part of this one isn't the roads, it's the well data. We maintain our own
routable road network for the areas we operate in. Building that network dataset
the first time is a manual, one-time step, but once it exists, a pipeline
can rebuild the Navigator mobile map package (CreateMobileMapPackage
with the map, locators, and the network dataset, clipped to the AOI) and republish
it to ArcGIS Online via SharePackage every night, with nobody touching
it.

Three completely different things can each set off the same chain: a new mobile map package gets built and republished to ArcGIS Online, no one has to decide to do it.
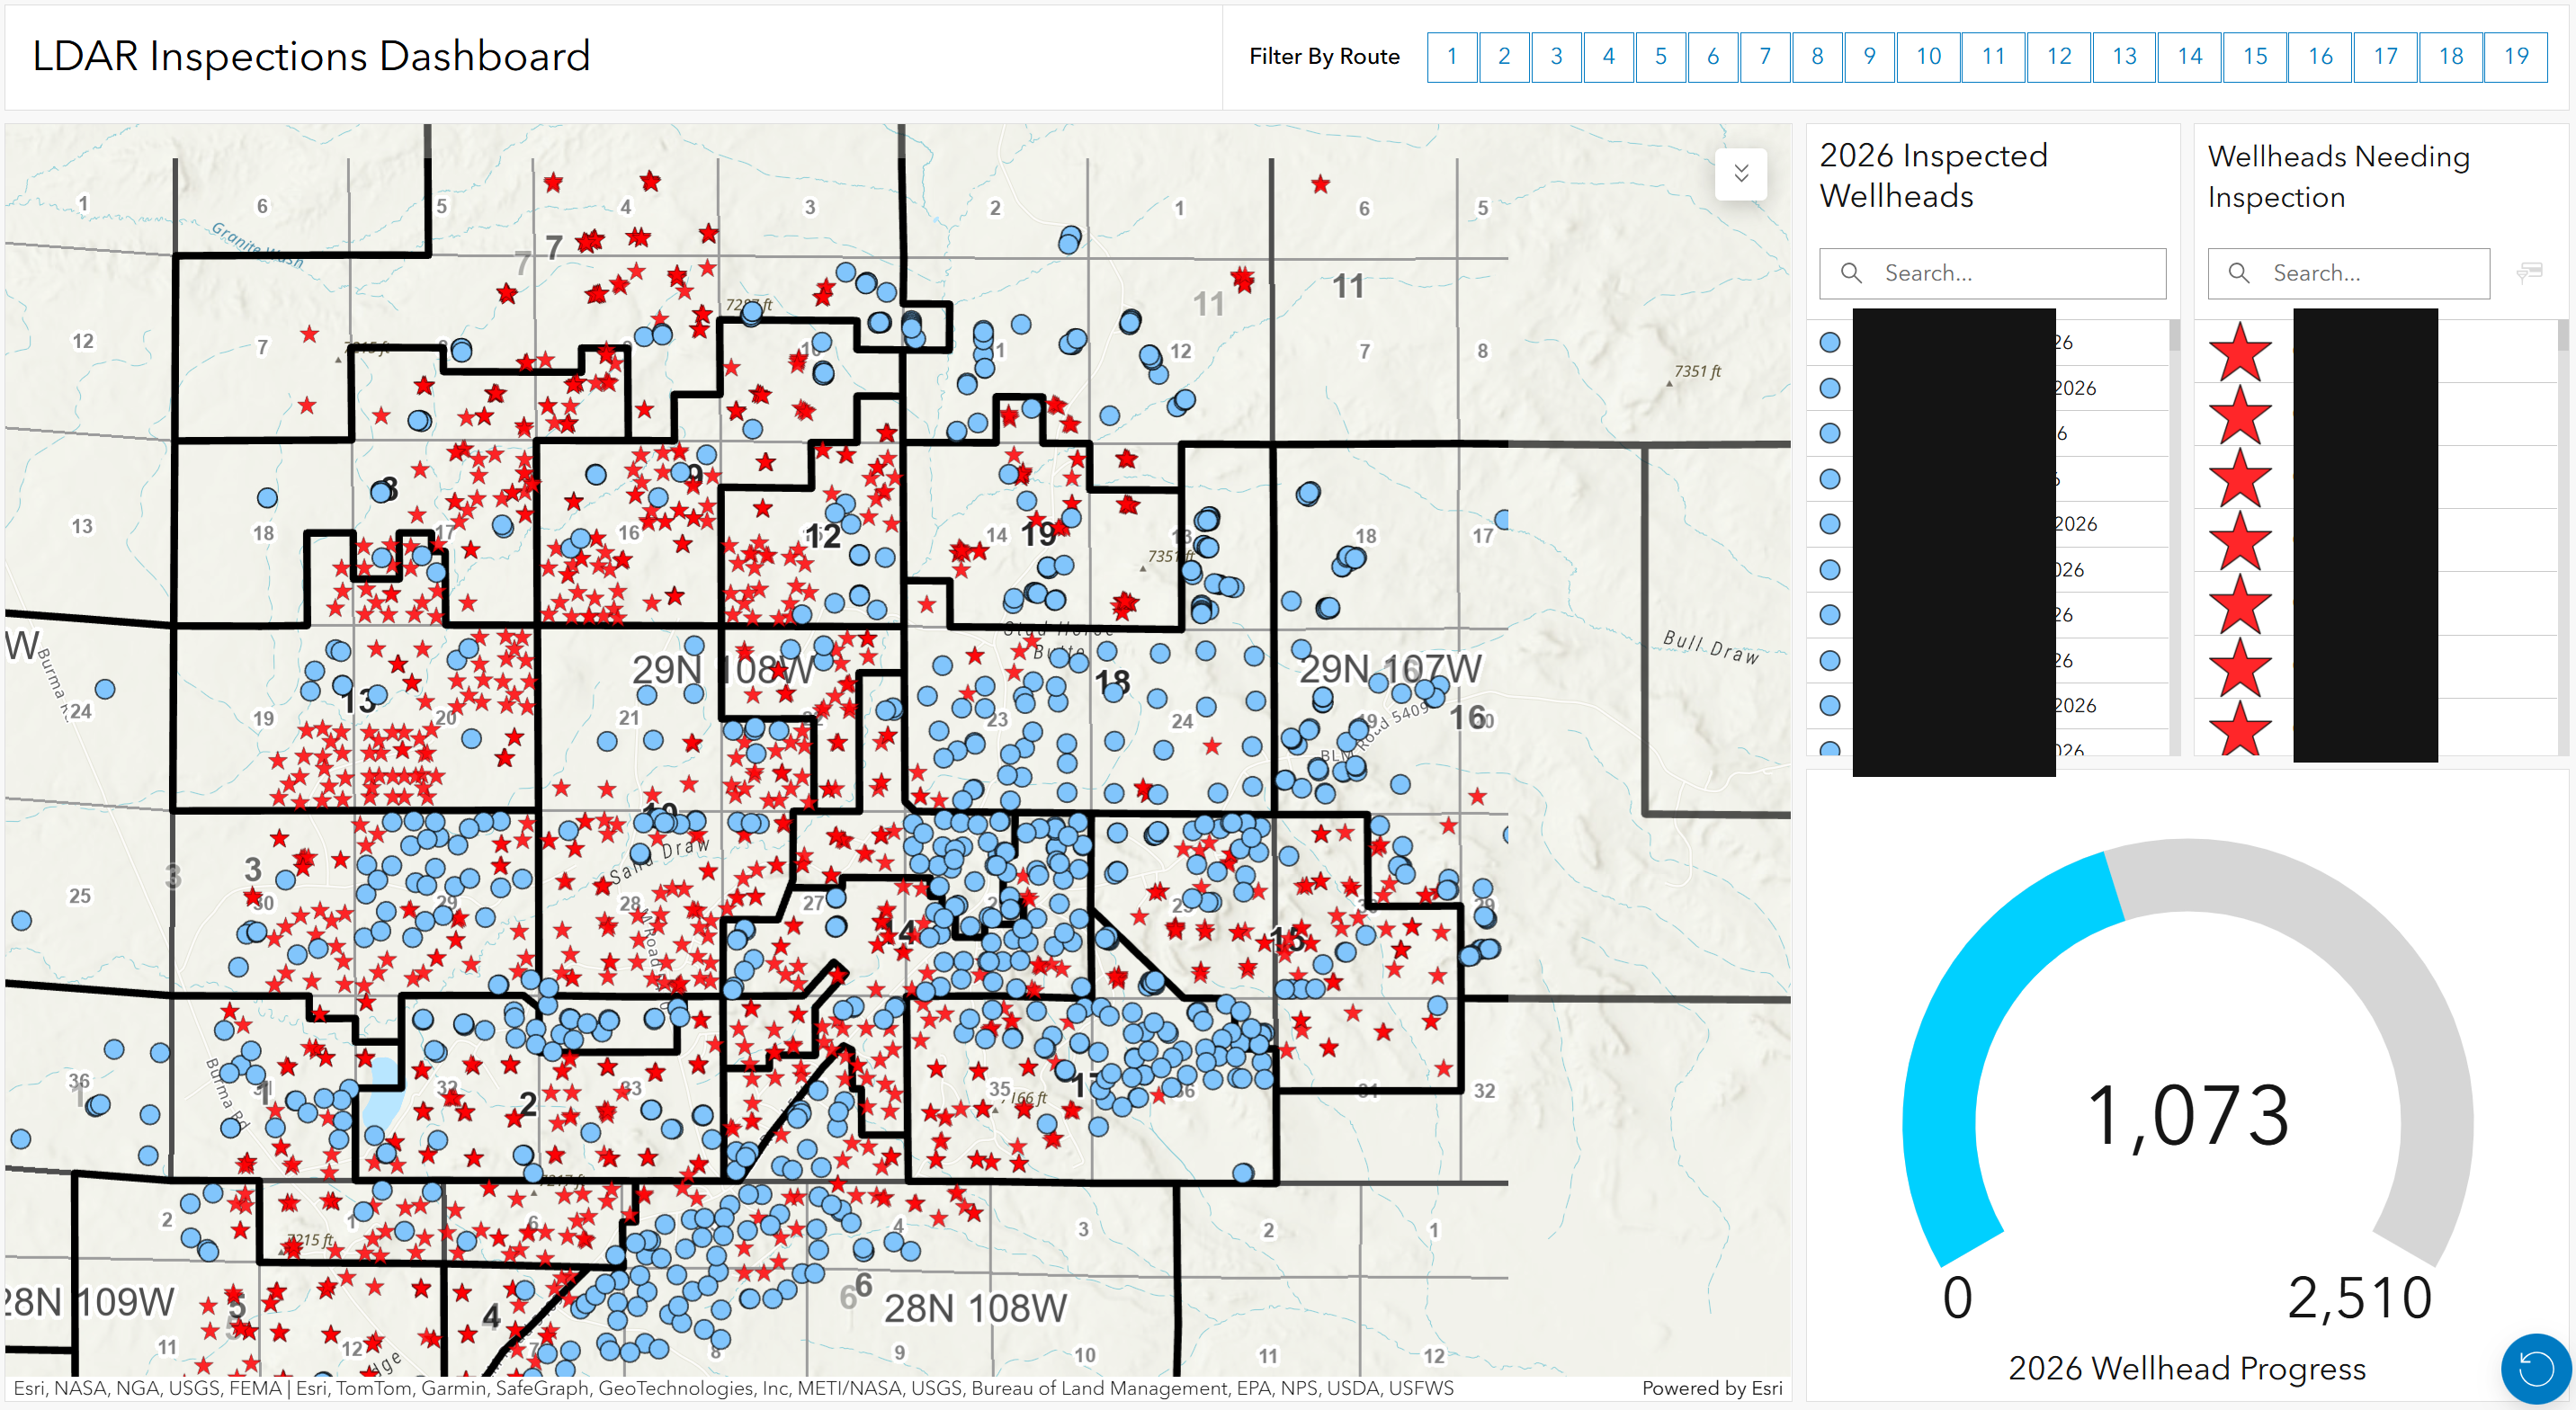
SharePackage, into the field navigation group.LDAR inspection records come from the EHS DataMonster API. The same pipeline pushes that data two directions at once.
This is the actual dashboard, restyled for the slide. Red star or blue circle, every wellhead, and nobody sets that color by hand.
Tap a site in Field Maps and hit Navigate, and it hands off straight to our Navigator app for turn-by-turn directions. No re-typing an address, no separate app to hunt for the location in.
This is also exactly why accurate Well Catalog location data matters so much: Navigator's routing is only as good as the well and road data feeding it. Bad coordinates upstream mean bad directions in the field.
ArcGIS Enterprise runs behind the firewall for web maps, SSO, and security, effectively unlimited since every employee on the network gets an account at no extra cost. Navigator and Field Maps run on ArcGIS Online instead, because named-user AGOL licensing works better for field crews than authenticating them against Enterprise from outside the firewall.
JE_Employees AD group against Portal's enterprise users and creates an
account for anyone missing, Viewer role, SSO login, no password to set. A new employee
has ArcGIS access on day one without anyone filing a ticket.
This is the actual nightly email, reproduced exactly. Name, username, and email below are fake.
The accounts below are still active in ArcGIS Online with a named-user license, but appear deactivated or not found in Entra ID. Review and revoke the AGOL account/license if the person has been terminated.
| Name | AGOL Username | User Type | AGOL Role | Entra Status | |
|---|---|---|---|---|---|
| Jordan Blake | JE_JORDANBLAKE | jordan.blake@example.local | creatorUT | org_user | Not found in Entra |
The office floor plan was digitized in ArcGIS and exported to GeoJSON, light enough to load fast in a browser, then hosted as a single-page HTML app on Azure with MSAL sign-in against O365, open to the whole company. The layout itself is static; nobody's knocking down walls, so once the floor plan was built, the only thing that ever changes is the people in it, and that comes straight from Entra: desk assignment, title, and photo synced from Teams/O365.
Office floor plan pulled straight from Azure AD, showing who sits where, updated live as people move desks or change teams. Photos sync automatically from Microsoft Teams / O365, so the moment someone updates theirs there, it's here too.
The PDF floor plan that used to be painstakingly updated by office staff is georeferenced onto the real-world building footprint our office space occupies, so this isn't a cartoon, it's real geographic, digitized data. Teams photos are pulled every 4 hours during the workday, which catches new hires, title changes, last name changes, and office moves without anyone updating anything by hand.
Company-wide photo directory, refreshed hourly from Azure AD. Search by name, team, or office, no separate HR platform license required. Photos sync automatically from Microsoft Teams / O365, so the moment someone updates theirs there, it's here too.
Since we'd already pulled this data together for the seating chart, we realized we had phone numbers, emails, job titles, faces-to-names, and direct reports sitting right there in Graph API. With corporate and field offices opening in new locations, our culture committee put in a request for an employee directory to help foster collaboration across the country.
IIS logs get parsed nightly into SQL, the same pattern BP presented at an Esri UC years ago. The value isn't the adoption chart, it's finding power users who never call us when something's wrong, so we can reach out first instead of waiting on a complaint that never comes.
A few real lines from the raw IIS log, sanitized. Every request looks like this before anyone makes sense of it.
This is the actual nightly report, reproduced exactly. Names below are fake.
The accounts below logged the most sessions over the last 30 days across ArcGIS Enterprise and internal web apps. They're flagged for direct outreach, not because anything's wrong, but because they're the ones who can actually tell us what needs fixing.
| Name | Department | Sessions (30d) | Most-Used App | Peak Hour |
|---|---|---|---|---|
| Morgan Ellis | Land | 47 | South Texas Development Map | 9 AM |
| Priya Nair | Drilling | 39 | Drill Schedule Dashboard | 7 AM |
Every web map request in ArcGIS Enterprise and every visit to our internal web apps gets logged: IIS logs and Application Insights both push to SQL nightly, and this is that data, live. Filter by time range and source to see what gets used, and by whom.
Share ideas on cool stuff you're doing, pitch me an automation workflow you think would be awesome to implement, or ask about anything from the talk. Here's a few things we didn't get to:
Come find me after if you also think it's cool, want to hear more, or can teach me something about it. That's a genuine invitation, not a polite brush-off.
PACKEDDATA, no header, no delimiters, just interleaved float64
easting/northing pairs packed back to back. We reverse-engineered the byte layout
station by station, cross-checked the decoded extent against Kingdom's own stored
bounding box to prove we'd read it right, and now a nightly job turns that blob
straight into live wellbore geometry, no vendor export required.
IHS Kingdom stores deviation surveys as a proprietary binary blob (PACKEDDATA
in T_DeviationSurvey2). We reverse-engineered the format: interleaved
float64 easting/northing pairs, 16 bytes per survey station. A nightly job reads it
straight from SQL and rebuilds every wellbore as live GIS geometry, plus surface-hole
and bottom-hole points, loaded into the enterprise geodatabase.
PACKEDDATA is one flat array with no header. Here's what actually comes back
from SQL for one well, an 8-station survey, 256 hex characters with nothing marking where
one station ends and the next begins. (Representative example, not a real production
well.)
num_stations column is the only reason we know where to stop.
BoreholeID just
tells us which well the blob belongs to.
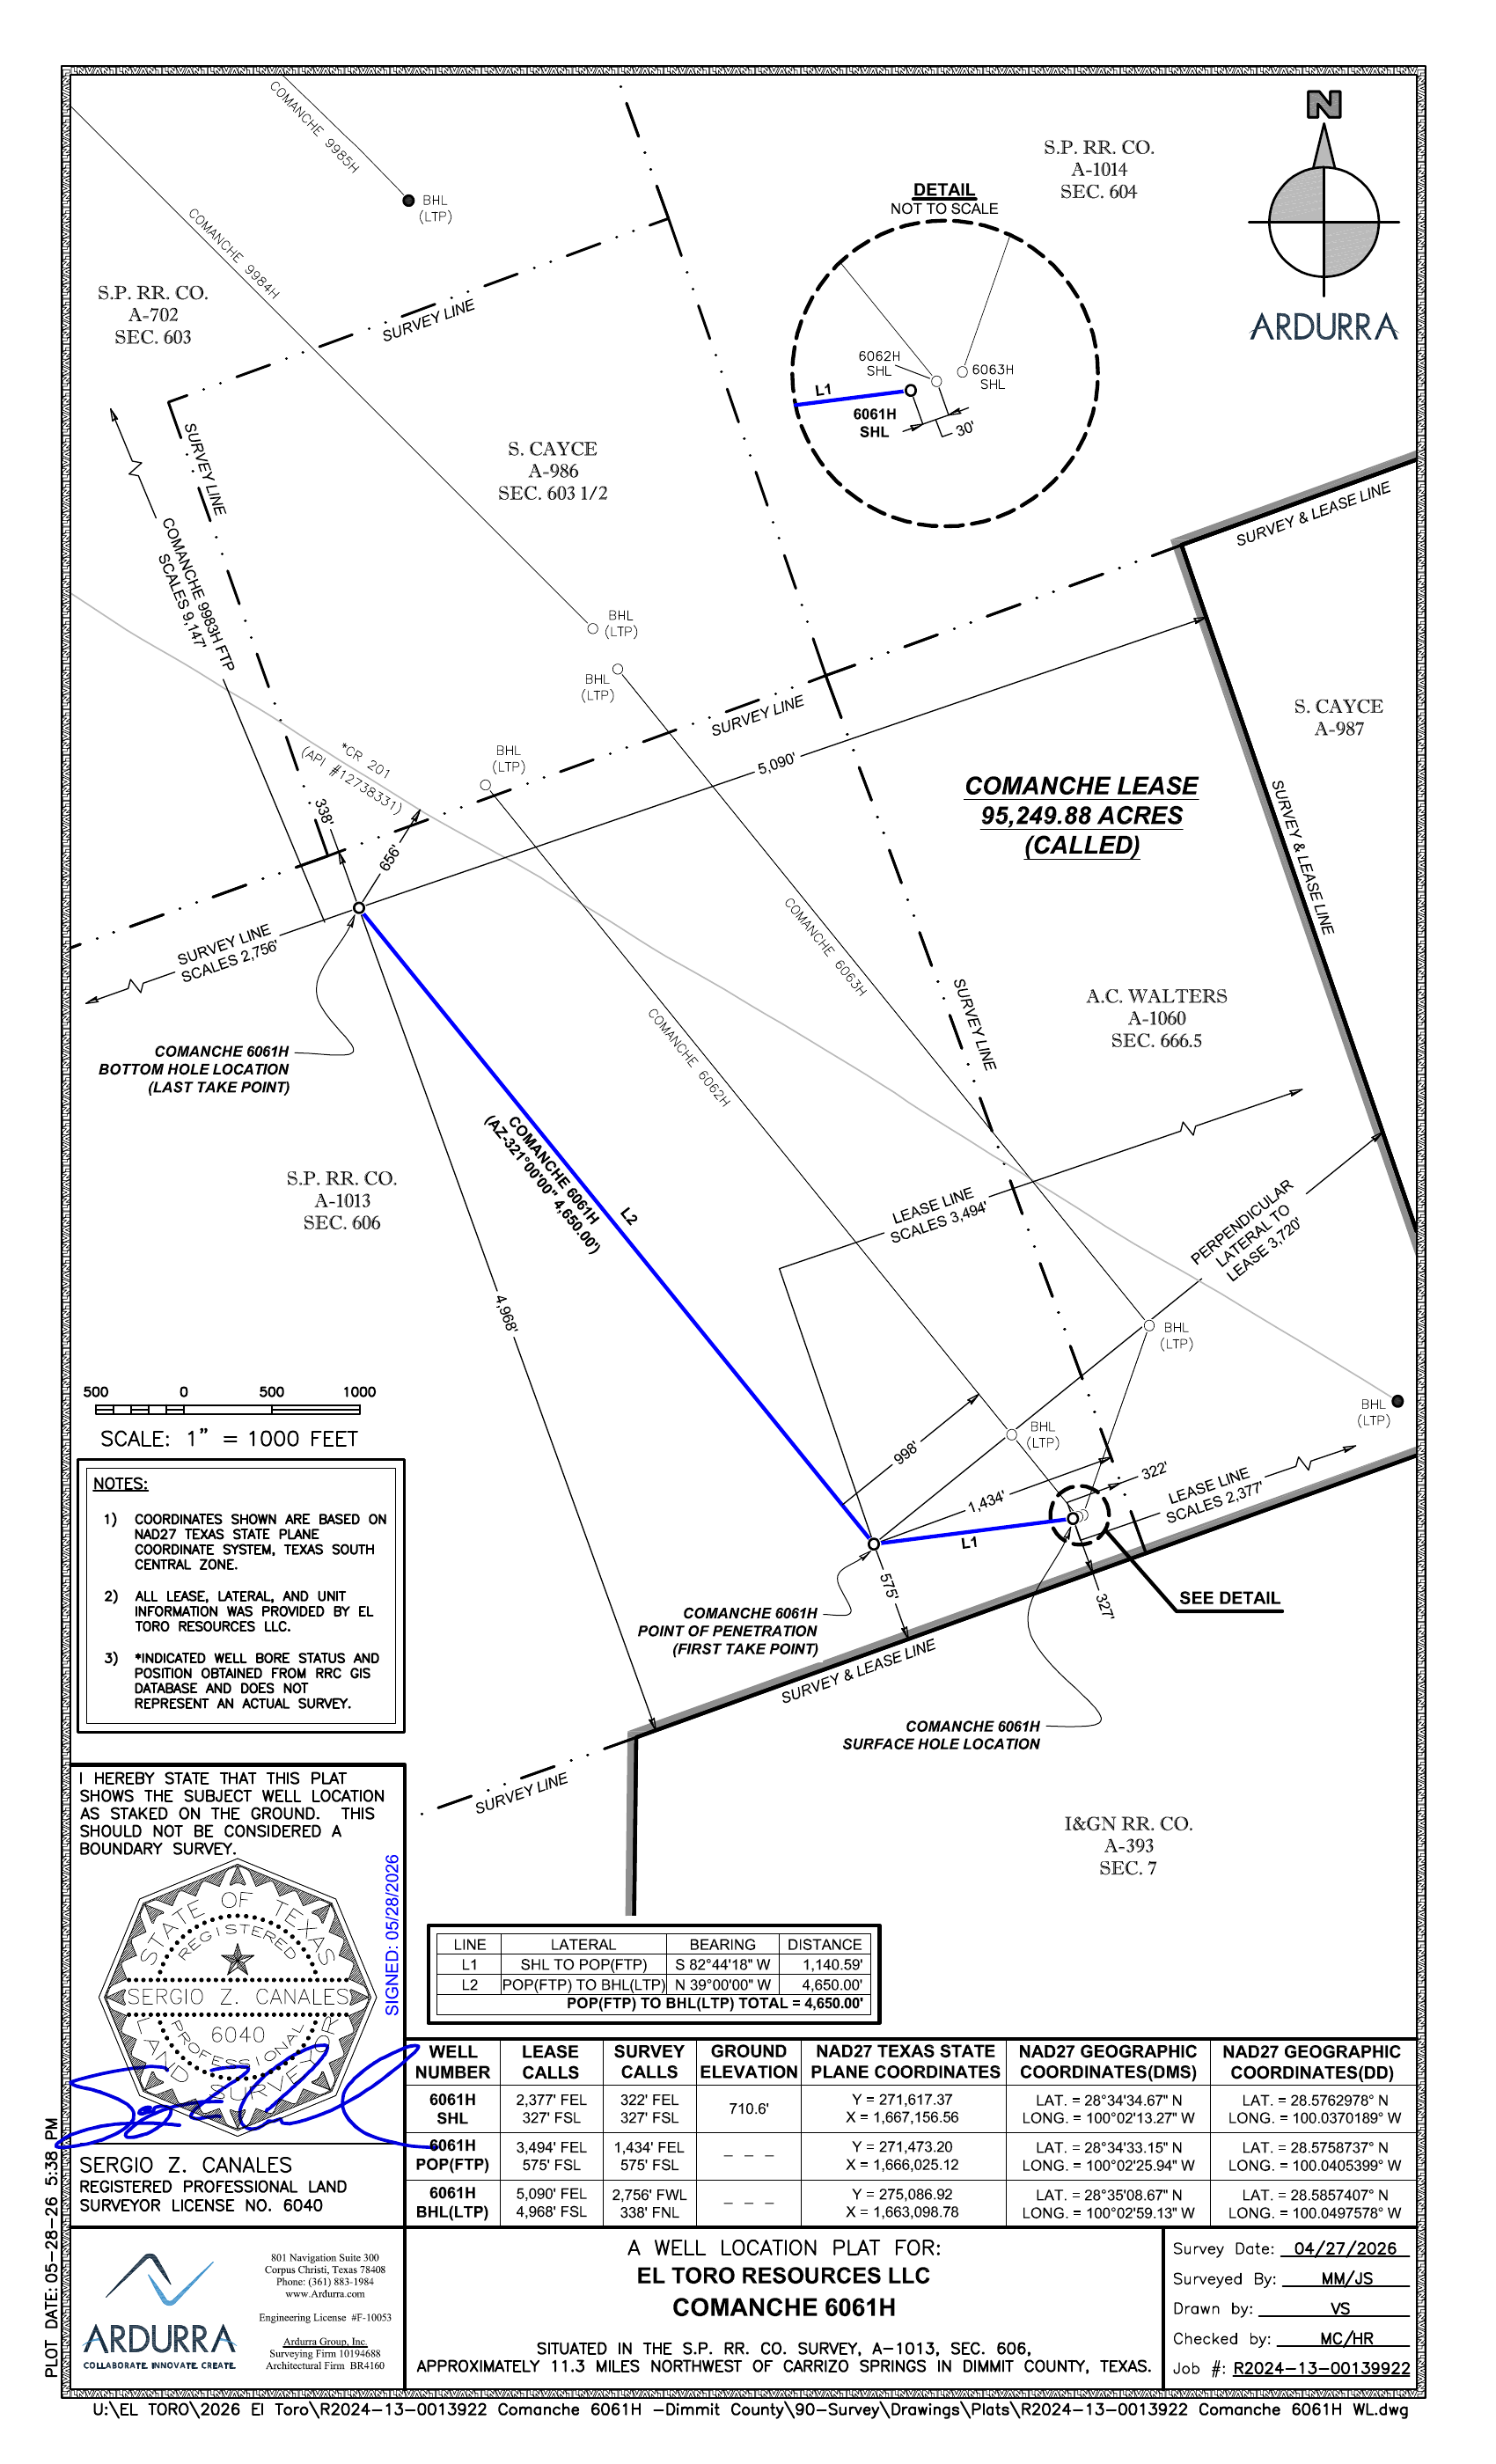
The RRC has the data but no clean API: the GIS service returns a point and an API number with no attribution. Every weekday at noon, a scraper checks the Texas RRC for new permit filings near our acreage, then uses Claude and Claude Code to backfill attribution from the W-1 detail pages (operator, lease, well number, county, depth) read from named hidden form inputs so it survives layout changes, and pulls the plat PDF for each permit.
This is a real W-1 plat, the kind the RRC scraper pulls automatically. The boxed fields are exactly what Claude extracts: State Plane coordinates, DMS, and decimal degrees, for the surface hole, point of penetration, and bottom hole.